Unsolvable Problems – A Math Story With a Moral

By Anupum Pant

True Story

Back in 1939, a first year doctoral student at Berkeley, George Dantzig arrived late for a statistics class one day. On the board, professor Jerzy Neyman, a renowned mathematician, had written two problems, and it wasn’t very clear to George what he had written them were for. As any other student would assume, George assumed them to be homework problems and noted them down.

He went back and started working really hard on those problems. They seemed a little harder than usual to him. Nevertheless, George was determined enough. After a couple of days, when George was satisfied with his solution, he went to his professor and apologized to him for taking so long to finish the homework. Without looking at what he had done, the professor told him to put the work on his table, and he’d see it later. George did exactly that.

Six weeks later, on an unsuspecting Sunday morning, at 8:00 in the morning, George was awakened by a frantic knock on the door. It was professor Neyman. With a pile of papers in his hands, he seemed very excited. It was only then, through professor Neyman, that George came to know what he had done on those papers six weeks back.

Six weeks back, those two problems which George mistook for homework turned out to be two examples of unsolved statistics problems Neyman had written on the board. George had unknowingly noted them as homework, and ended up solving the 2 unsolved statistics problems.

Later the papers on these problems were published. However the second one was published much later, in the year 1950.

Moral: When people are not tied down by prejudice, by putting in good work, they often manage to achieve extraordinary things.

Via [Snopes]

A Mathematical Guide to Optimize Pizza Buying

By Anupum Pant

The logical engineer in me has always paid a lot of attention to how well my money is being put to use, or if something I bought was well worth it. So, before buying anything, I usually love to add in a basic mathematical calculation that would ensure the best logical use of my money. I used to do the same when I was studying engineering and had come up with a handful of tricks, which enabled me to eat the best food, in best quantities at the lowest prices.

Optimized Pizza Buying

Till date, I had relied on calculations for individual joints to buy the pizza that gave me the best value for money (irrespective of what my stomach could fit). In other words, I had never used statistical methods, as I always went to only 2 or 3 pizza places and never felt a need to do it statistically.

So yesterday, while skimming through blogs on NPR, I came across a post by Quoctrun Bui, where he had calculated the best valued pizza size using statistical methods. 

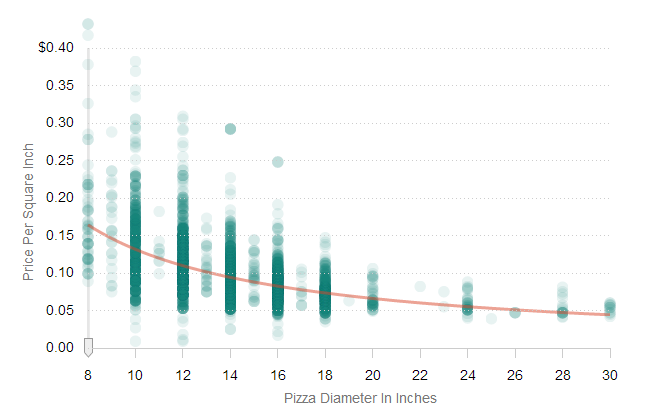
The final findings of his study based on 74,476 prices from 3,678 pizza places were condensed into a graph which depicted data as follows (here is the link to the article for an interactive version of the graph).

pizza guide

Conclusion

The above graph plots 74,476 data points to find the pizza size that gives you the best value for money. The y-axis plots price-per-square-inch – the lesser price-per-square-inch you pay, the better deal you score.

This basically means that buying the largest pizza gets the most value out of your money. As the size increases the value for money increases or the price you pay per-square-inch of pizza decreases. – Statistically speaking.

Adding value

I felt a need to add value to the study by finding how well ‘buying a large pizza’ to get the best value works in India.  So, I selected a popular joint Dominos (where I go all the time) for the test. I dug out their menu (probably an old one) to see if buying the large pizza always works in India. Here is a record of price you pay per square inch at Dominos for various sizes and categories of pizzas. (Click the image to see a better version)

pizza buying guide dominos
I did not pay much attention. Please point if there is a mistake.

Conclusion (Dominos India)

  • No, always buying the large pizza clearly is not the best option at Dominos in India.
  • A small pizza is the best option (economically) if you are buying from the categories: Simply veg, Veg I or Simply Non-veg.
  • A large pizza is the best option (economically) if you are buying from the categories: Veg II, Non-Veg I or Non-Veg II
  • Never go for the small Non-veg II pizza. It is the worst choice you can make.
  • Never ever get a medium pizza from any category!

I’d love to see someone doing the same thing for other popular pizza joints. Do get back to me if you have done it. I’ll add it to the article as an update.


Enhanced by Zemanta

Benford’s Law Will Make You Wonder For a While

By Anupum Pant

Benford’s law is a fairly simple law to grasp and it will blow your mind. It deals with the leading digits of numbers.

So, for example, you have the number 28 – The leading digit for it would be 2. Similarly, the leading digit for 934 would be 9. Just pick the first digit. Now…

In a data set you’d say – it is common sense to assume that the probability of leading digit one (1) appearing would be more or less equal to that of leading digit nine (9).
As there are 9 possible leading digits, you’d think that the probability of each leading digit would compute to something around 0.11
You’d imagine that it would be normal to assume a nearly straight graph of probability vs. leading digit. But this isn’t true.

Benford’s law says

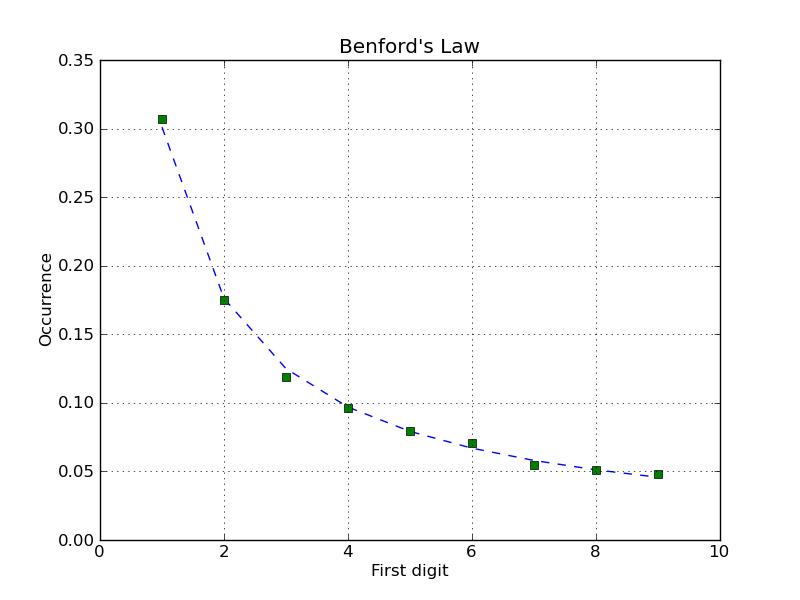
Your common sense fails. What actually happens is that the likelihood of 1 appearing as the first digit in a data set is around 0.3
For the following digits, the probability keeps decreasing. And the following graph appears. You’ll see that the numbers rarely start with nine!

Benford2

When does it work?

This counter-intuitive result applies to a wide variety of natural data sets. It works the best if your set spans quite a few orders of magnitude. Natural set of data like stock prices, electricity bills, populations, which could range from few single digit values to several digits work the best. Other data like the heights of people doesn’t work because it does not span “quite a few orders of magnitude”. Also, artificially tampered data fails to comply because the person who tampers does the same mistake everyone does. Therefore, Benford’s law is also used to detect frauds in data.

Example:

  1. Count the number of data points in a data set which have the leading digit 1 and write the number next to the number 1 in a table.
  2. Then, keep repeating it for all the numbers 2, 3, 4 and so on.
  3. Calculate the probabilities for each. In the end you’ll be left with a table that would look something like this. (Probability = Number of Data Points for that  digit / Total Data Points)
Leading Digit Digit Probability
1 0.301
2 0.17
3 0.125
4 0.097
5 0.079
6 0.067
7 0.058
8 0.051
9 0.046

How does it work?

Watch the  following video for the explanation:

Try it yourself: [Kirix]

Sharks Are Not So Bad After All

By Anupum Pant

Sharks have been on earth for millions of years more than we have been here. Also, they haven’t changed much since a long time. The kind of sharks we see today, were the same sharks that existed 350 million years ago.

That means, modern sharks have lived happily for millions of years without eating humans. Even today, they aren’t very keen on killing us for food. They simply aren’t designed (or haven’t evolved) to do that. Humans were never a part of their normal diet. Instead, they normally feed on small fish. While a few other species of sharks may eat seals, sea lions and other mammals too. In fact, they can go on for months without food.

Funny as it may sound, sharks are scared of humans. When a shark sees a human in water, it gets confused and scared. It goes near to check,  and this usually results in an accidental bite. They don’t kill humans out of aggression. With 15 rows of razor sharp teeth on each jaw, even their gentle bites may kill a person. About only 20 out of 300 species of sharks are reported to have been involved in accidents with human beings.  About 100 such accidents occur every year.

Not being insensitive about human deaths: Can you estimate how many people do sharks kill every year? The answer is 10. Ten people, on an average are killed by shark bites every year. That is about 1/15 th of number of people killed by coconuts every year*
*Note: “150 people are killed by coconuts every year”, is a popular urban legend. The coconut death figure is a crude estimate or just a figure pulled out of thin air.

Nevertheless, the number of people killed by sharks every year is very very less (again, even a single human death isn’t really ‘less’). I’d rather not use statistics to prove my point. [image]

Why are sharks scared of us? … Why shouldn’t they be?
We kill about 100 million sharks every year. That is such a huge number when compared to number of people sharks kill every year. Again, statistics could be deceiving here. But we do get an idea. There is a massive difference in the number.
Why? Humans catch sharks for their meat, internal organs and skin,  to make products such as shark fin soup, lubricants, and leather etc. Some times, fins are cut and live sharks are thrown back into the sea, crippled. This eventually kills them due to excessive bleeding or other obvious reasons.

It is ironically that we move into their natural habitat and in turn blame sharks for destroying our boats, surf boards. Moreover, we are shocked to hear about reports of shark attacks on humans. Shouldn’t it be the other way round? We should stop looking at sharks as if they are the monsters; we are. At the same time, that doesn’t mean you should risk your life by going in shark waters to give it a high-five.

Random Science Fact:  

Only 14% of the Earth’s species are known to us. 75% of all the species on Earth will be gone within the next 300 years. Think about those species which will go extinct while we are here, and we’ll never know about them.