10 Steps to Structuring a Scientific Research Article

Bridgette Hernandez

Writing and formatting often go hand in hand. In anything from scripts to essays, there needs to be some kind of order. Especially when dealing with difficult concepts, a robust structure can help your readers stay afloat.

In the world of science writing, structure is that much more important. Research articles pack in a lot of information. You don’t want your readers to feel bombarded. Help your readers follow along with these ten steps.

Pick a Clear and Succinct Title

Many writers struggle with picking the perfect title. It’s understandable. The title is the first thing a reader sees. However, choosing the right title will be what helps to draw readers in. Try to include plenty of description.

Long titles should be avoided at all costs. Of course, it can be easy to get carried away. There is a lot to say! Still, shorter titles will capture readers’ imagination more easily.

Include an Abstract

An abstract gives your reader a “preview” of the content. Another way to see it is a summary. Abstracts make research articles scannable. When dealing with a lot of information, they help readers decide which texts to read. Use that your advantage.

Continue reading 10 Steps to Structuring a Scientific Research Article
Reading and plotting data in Jupyter notebook

For this tutorial I am going to assume that you have some idea about using either Jupyter notebook or Python in general. I also assume that you have Anaconda installed, or know how to install packages into Python. If you do not, then I would first suggest putting a few minutes aside for installing Anaconda and taking a crash course in Jupyter.

The data structure

I am breaking down the data that I’m going to work with because the things I’m going to talk in this post can be applied to any other data which looks similar – That is, a simple two column data, which when plotted will form a 2D line plot with an x and y-axis.

In my lab we use a spectrometer to collect data. For the uninitiated, a spectrometer is basically a fancy prism with a camera at the rainbow end to take a black and white picture (intensity) of the rainbow. The data in this case is formed by spatially dispersing an input light into its constituent colors (wavelengths of that color). The intensity for each color is recorded using a camera. That is two columns of data – Wavelength is the first column, in nanometers and Intensity is the second column (photon counts, let’s say). The data file, of a near-infrared spectrum around 900 nm, if opened in a text editor, would look as follows.

900.0999819	1072801
900.200739	1087873
900.3014958	1101660
900.4022521	1113931
900.5030081	1118967
900.6037637	1099496
900.704519	1097624
900.8052738	1113681

If you would like to use the same data file I am using, you can download it from here.

Now, note that ASCII files like these are easier to handle for us starters and should show good numbers when opened using notepad or Microsoft excel.

Other proprietary formats such as the ones that directly come out of our spectrometer, like .SPE formats (for Princeton instruments cameras) is a binary format. These will give you garbage if you try to open these with notepad or excel. There is a way to open these using Python, but you need to have a detailed information about the format and construct the code accordingly to read them properly. In this post I’m going to deal with simpler ASCII (text, CSV files etc) files only.

If you are dealing with SPE or other such difficult file formats, I would suggest using a file conversion software that usually comes with the equipment to export the binary file to txt or csv format.

Continue reading Reading and plotting data in Jupyter notebook

DIY Decoration: Make Chalkboard Globe

Chalkboard paint is great for labelling and decorating the items inside the home. Here, you will learn to make chalkboard globe. You can put this globe on your office table or study table. This unique chalkboard globe will not only enhance the grandeur of any table but also add the splendid look to that. This DIY project requires following supplies to get completed:-

  1. Globe.
  2. Rust-Oleum Chalkboard Spray Paint.
  3. Old Newspaper.
  4. Painter’s Tape.
  5. Chalk.
  6. Duster.

Find the Place to Work

Just search the best place to work. Well-ventilated area like porch would be the best place to do the job. Once the area is discovered to work, cover that with old newspaper in order to keep the floor clean.

Continue reading DIY Decoration: Make Chalkboard Globe

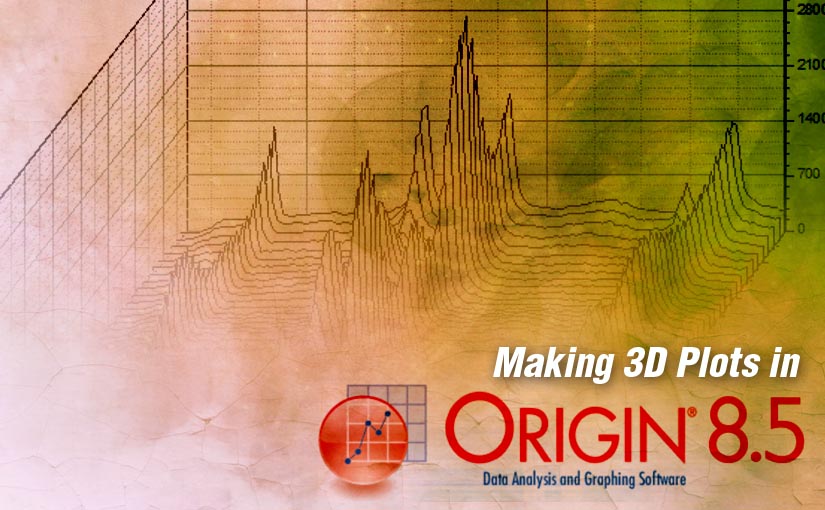
Making 3D Plots in OriginLab OriginPro

When I first wanted to use OriginPro to make 3D plots for my Raman and photoluminescence data I struggled to find a solution for little problems for hours. It was not like I had no one to consult, but I wanted to figure it out myself because the same philosophy with learning things previously has helped me immensely in learning things with authority and developing my own characteristic style, by putting in an extra amount of time and hard work.

Check with your university, there’s a big chance that they offer you students a free copy of OriginPro. It is an amazing piece of software, easy to learn and can make plots beautiful enough to be published in Science or Nature.

However when I was toiling through things, I also wished someone who had gone through the same thing could have documented it somewhere. Not surprisingly, no one had. So I wanted to. Here it goes.

Continue reading Making 3D Plots in OriginLab OriginPro