Sun’s Green Flash

By Anupum Pant

More often while setting than rising, if the conditions are right, a part of the sun (on the top) can appear green. This happens for very short interval lasting for about 2-3 seconds and is considered a rare phenomenon. Since it is green and lasts for a very small interval, it is also called the green flash, emerald flash or green ray. If you have ever captured it or plan to do it in the future, do share your results with me through mail/twitter. [See the animation] [Real GIF]

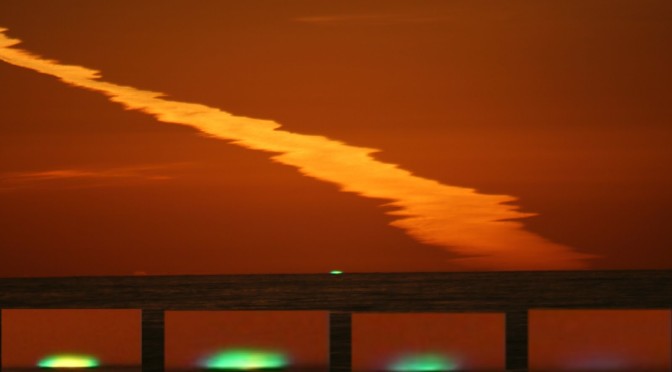
What does it look like?

Sometimes the sun’s rim can appear green (in optically zoomed images). Otherwise, when the sun is set, for a brief moment, it appears as if a part of sun has separated from the main body and has turned green. It is usually seen as a horizontal line, like in the video below. But, a few lucky ones have captured complete green auras too.

Why does it happen?

The sun gives out a white light, which contains all the colors – Green is one among  them. Normally, our eye isn’t able to resolve the separate colors and sees them as a mixture which is white. When the sun sets, our atmosphere acts like a prism and bends the colors. A few colors get bent more than others. For example, green bends more than red. As a result the two colors get separated enough to be resolved by our eye. But the right amount of bending happens only if the atmospheric conditions are right.

In extremely rare cases, blue or violet flashes have been reported. [image]

For a detailed explanation you can go through this – [Geometric Optics of Green Flashes]

At poles where the sun moves in a different manner, probably the green ray can last much longer. Admiral Richard Byrd has claimed to have seen this green flash for 35 minutes while on an expedition to Antarctica.


The Coastline Paradox

By Anupum Pant

The length of Australia’s coastline according to two different sources is as follows:

  1. Year Book of Australia (1978) – 36,735 km
  2. Australian Handbook – 19,320 km

There is a significant difference in the numbers. In fact, one is almost double the other. So, what is really happening here? Which one is the correct data?
Actually, it depends. The correct data can be anyone of them or none of them. It completely depends on the kind of precision you decide to use while measuring the coastline. This is the coastline paradox.

The coastline paradox

The coastline paradox is the counter-intuitive observation that the coastline of a landmass does not have a well-defined length. – Wikipedia

The length of the coastline depends, in simple terms, on the length of scale you use to measure. For example, if you use a scale that is several kilometers long, you will get a total length which is much less than what you’d get when you would use a smaller scale. The longer scale, as explained neatly in this picture, will skip the details of the coastline.

This is exactly what happened when the two different sources measured the coastline of Australia. The first, Year Book of Ausralia, used a much longer scale than the one, Australian Handbook used. Ultimately, the great disparity in the result had to do with the precision of measurement. Had they used a scale just 1 mm in length, the result would have been a whooping 132,000 km.

This effect is similar to the mathematical fractal, Koch’s flake. Koch’s snowflake is a figure with finite area but infinite perimeter. Veritasium explains it better in this video:

Another factor is to take into account the estuaries to measure the length. Then,what about those little islands near the coast? and the little rocks that protrude out of the water surface? Which ones do you include to come out with the data?  And the majestic Bunda cliffs? Probably this article from the 1970’s clarifies what was included and what was not during the time the results were published.

So, the next time someone decides to test your general knowledge and asks you the length of certain country’s coastline, your answer should be – “It depends.”

Largest Meteorite Left No Crater On Earth

By Anupum Pant

You should know: Meteor vs. Meteoroid vs. Meteorite

Meteor: The streak of light that we see in the sky is “Meteor”. When debris enters earth and gets burned up while entering, it leaves a streak of light. Unlike what is popularly believed, meteor is not the debris itself rather the word “meteor” refers to only the flash of light.

Meteoroid: A meteoroid is a mass that is small – ranging from a kilometer to only a few millimeters in diameter. Most meteoroids that enter the Earth’s atmosphere are so small that they vaporize completely and never reach the planet’s surface.

Meteorite: If the Meteoroid survives and reaches the earth’s surface, it becomes a Meteorite.

Hoba the Meteorite

About 80,000 years back, a ridiculously huge mix of Iron and Nickel entered the earth. It was so large that what was left out of all the burning through the atmosphere, measured 66,000 kg in the end. About half ton of this meteorite has gone to laboratories for research. Even after accounting for losses towards laboratories and vandalism, it is still the largest single mass of natural Iron on the Earth’s surface. It is the largest meteorite ever discovered till date and is called “Hoba”.

This meteorite was discovered by a farmer in Namibia in the year 1920. Since then, due to its mass, it has never been moved. The meteorite and the site has been declared as a national monument by the Namibian government and several tourists visit it every year.

Farmer’s Story: 

One winter as I was hunting at the farm Hoba I noticed a strange rock. I sat down on it. Only its upper part was visible. The rock was black, and all around it was calcareous soil. I scratched the rock with my knife and saw there was a shine beneath the surface. I then chiselled off a piece and took it to the SWA Maatskappy in Grootfontein, whose director established it to be a meteorite.

If that was hardly interesting…

The most puzzling thing about this meteorite is probably not that it belongs to a very rare class of meteorites (Ataxite), but the fact that it has no crater to be seen around it. Normally, a meteorite of this size should have left a crater hundreds of meters wide.

The best theory that explains the absence of any preserved crater around it is that, this piece of rock must have hit the earth’s surface at a very low angle. As a result, it must have skipped on the surface like a flat stone on water surface. And in the end, must have landed at the place where it lies today.

Paper Bags Are Not Better Than Plastic Bags

By Anupum Pant

Plastic bags are terrible things. They choke animals, aren’t easy to recycle, do not break down, pollute our oceans, their production adds to our oil demands…and the list goes on. Some time back, we realized their ill effects and started taking steps that would encourage people to use bags made of alternative materials. Furthermore, several cities all over the world have banned the use of plastic bags.

Side Note: Interestingly, plastic bags aren’t actually banned for any of those reasons. They are banned because they tend to fly with the wind and move out of your trash fairly easily. They create a mess at places where they aren’t supposed to. That is the major reason as to why they are being banned.

In 2007, San Francisco banned plastic bags for supermarkets and pharmacies. Last year, it got expanded to all retail stores. Now, they have been banned for restaurant takeaways too. Also, the use of plastic bags at retail stores has been banned in several Indian cities. But the point isn’t to list out all the cities where it has been banned. There are many cities. I hope you get the idea…

When it comes to finding an alternative for plastic bags, paper bags seem to be the first choice. But it turns out, paper bags are not better than plastic bags.  Most of us underestimate their ill effects. Here are a few reasons that will make you realize why paper bags are not so good:

The point isn’t to make paper bags look bad or to make plastic look good or vice versa. It is to dispel the image of “the green paper bag” from our minds.

Reasons

Production: Production of paper bags all over the world involves cutting down 14 million trees every year. It is estimated that the production of paper bags creates 70 % more air pollution than plastic bag production.
Production of paper bags also results in much more water getting polluted when compared to the production of plastic bags. This is because their manufacturing process requires a lot of water.
Almost the same amount of petroleum used for plastic bags (for the material) gets consumed in making of paper bags to fuel the machines plus transportation.

Weight: Paper weighs a lot more than plastic. It is estimated that to carry the same number of paper bags it takes 7 times the transportation it takes to haul plastic bags. More trucks, more pollution, greater greenhouse impact.

Space: Paper bags occupy a lot more space than plastic bags do. This creates a problem at landfills that are getting filled to the brim already.

Recycling: Paper bag activists would say, plastic bags live for ever in the landfills. Yes they do, but there, paper bags do not decompose within a meaningful time period either. In fact, most of the stuff lives on for a long time in landfills. Landfills aren’t meant to make things degrade. With a paucity of oxygen and water in landfills, it is hard for things to decompose there. Even food items thrown away at landfills last for years.
That said, even plastic bags are almost never recycled.

Also they tear easily. As a result, more number of paper bags have to be used.

Solution

Both of them – plastic and paper bags – are equally bad. Recently developed biodegradable plastic bags are not any good either (they have a bigger carbon footprint). Carrying canvas, cloth or jute bags and saving them for future use is probably the best alternative.

If you liked this, you’ll probably also like – Understanding the Impending Helium Crisis

The Red Rain of Kerala

By Anupum Pant

Visit blogadda.com to discover Indian blogs

In the year 2001, between 25th July and 25th September, people from the Indian state of Kerela (Kottayam and Idukki districts) experienced a bizarre oddity – The Red Rain of Kerala. Sporadic heavy downpours of mysteriously colored water left the people of Kerala dazed. More recently, red rains were also seen in parts of Sri Lanka between 15th November and 27th December, 2012.

Yellow, Black and Green rains have also been reported several times since 1896.

Red Rain of Kerala – Studies

A study conducted in India showed that the rain was colored because these raindrops contained millions of spherical and oval red particles which had an internal structure. These things looked like biological cells. Initially, when scientists weren’t able to confirm the existence of DNA (a fact which has baffled scientists) in them, in spite of an internal structure present in the cells, some started claiming that the origin of these red particles was extraterrestrial, possibly, coming from an exploded meteor.

Later the mystery was solved, the presence of DNA was confirmed and a study, destroying popular media claims, concluded that the red rain of Kerala had been colored due to airborne spores originating from a type of algae. There was nothing alien about it.

The unusual color of the rain was due to the presence of a unicellular micro-organism belonging to Kingdom Protista, of the Phylum Euglenozoa, known as Trachelomonas. Trachelomonas was the main cause of reddish downpours in other regions of the world as well.

[Source: The Red Rain of Kerala]

The Standard World Map is Misleading

by Anupum Pant

Mercator’s projection

Most of us have this image of the world in our minds. This kind of a map, today printed in almost every textbook, known as the Mercator’s projection was first created to make work easy for navigators. Even Google Maps uses a Mercator-derived technique to project the world on a flat surface. But, Mercator’s projection has only deceived our idea of geographical area for all these years. For instance, it has led us into believing that Greenland covers an area which is almost equal to Africa (Also, have a look at the size of Antarctica there. Gosh!). The comparison of these two land masses actually looks like this.

According to this infographic, the actual size of Africa is larger than US, China, India, Mexico, Peru, France, Spain, Papua New Guinea, Sweden, Japan, Germany, Norway, Italy, New Zealand, the UK, Nepal, Bangladesh and Greece, all of them put together. In short, Africa is around 14 times larger than Greenland. Do not underestimate its area.

You can try playing with various combinations on this web app – map fight. Try these: Australia vs. Antarctica; US (contiguous) vs. Russia; and of course Greenland vs. Africa; they’ll leave you spellbound.

Why does this happen?

Since our planet is a sphere (an oblate ellipsoid really), to project it on a flat surface like paper, the actual shapes and sizes of landmasses have to be distorted to some extent. There is no way around it. Today, hundreds of different projection methods meant for various purposes are available, but none of them can exactly show the actual shapes & sizes of the landmasses. Some preserve the shape, some preserves the size, and others preserve direction…so on…

Mercator’s projection, the devious one discussed above, for example, uses a cylindrical projection. That means, it stretches the areas on a globe, which are nearer to the poles. Hence, the imprecise size of Greenland and Antarctica.

What is a perfect map, then?

Even after developing hundreds of projection method, we haven’t been able to spot the perfect method, nor will it happen in the future. But, to get the right sense of area, a projection method known as the Peters (also known as Gall-Peters projection) projection, is said to be the most accurate (in terms of area). It is also one of the most controversial maps.

Peter’s projection also has a huge fan following in spite of its terrible appearance.

Bonus Map Facts:

  1. National Geographic started using the, good looking, Robinson projection from the year 1988, and used it for ten years, then, it moved to the Winkel-Tripel in 1998.
  2. An ideal Mercator’s projection would have infinite height if it doesn’t truncate some area near the extreme poles.
  3. Peters pointed that the Mercator’s projection made developing countries seem much smaller than they actually are. He said that these errors made the struggles of developing nations near the equator looks much smaller to the developed world.
  4. XKCD published a comic on projections – “What your favorite map projection says about you.” 977. [see the explanation here]

Understanding the Impending Helium Crisis

by Anupum Pant

There is too much Helium?

Helium is the second most abundant element in the observable universe, present at about 24% of the total elemental mass. Helium is also the second lightest element. So, 24% by mass is too huge a mass for a single light element. It equates to a measure that is probably millions of times more than what humanity could use up in millions of years. Close to about 12 times the mass of all the heavier elements combined, this element will almost never run out. But, that is only when we talk about the universe. Back in Earth, it is completely a different story.

Helium sources for us

On Earth, Helium is relatively rare. It amounts to only a 0.00052% volume of the earth’s atmosphere. Although 0.00052% is not too less, you also can’t consider it as an abundant element. Moreover, extracting Helium from air is almost 10,000 times more costly than fractional distillation (mentioned in the next paragraph). So, all that Helium in air is nearly useless to us till better methods of extraction are invented.
Thankfully, Helium is also present under the surface of the earth. The source of this kind of deposit is, radioactive decays which take place down there. It mixes with the natural gas and is lost to space, if released into the atmosphere. It is separated from natural gas using a process called fractional distillation – The best process to make Helium.

The largest known underground reserve estimated to contain about 10 billion cubic feet of Helium is a federal reserve (mostly under Texas and Kansas). For years US reserves had been the largest global suppliers of Helium (90%). Even today, these reserves contribute to more than 35% of the total global supply. The price of Helium coming from this source has remained almost unchanged for a long time. While during the same period (10 years) privately held Helium prices have tripled. The gap in prices is increasing every day, creating a big distortion in the market.

Helium Usage

Uses of Helium range from manufacturing smart phone screens (all LCD screens) to optical fibers (Internet cables) to health care (MRI scanners) to scientific research etc. [Uses of Helium]

The Problem

Since Helium has been made artificially cheap due to the Helium privatization act, it is popularly believed to be a cheap gas and is wasted a lot. Instead of using it up for important things, we consume it by filling up party balloons, distort voices and other entertaining activities. In fact, the warning issued by the Nobel Prize winner Robert Richardson that Helium could be depleted within a generation, seems to have had no effect on us. We still continue to waste a lot of Helium, release it into the air and keep losing it forever. Not many realize that it is a non-renewable resource.

We have almost reached a crisis already, but it was temporarily averted by the congress. In the future, after about 6-7 years, when the Federal Reserve stops supplying it (at below-market prices), it could be a big problem. I’m not very optimistic about market adjusting within such a small span either. In under a decade, we’ll probably see smart-phone prices, optical fiber prices and health care (MRI scans etc.) prices shoot up precipitously due to this artificial market distortion, if we do not start using Helium properly.